Short-term demand management, Adelaide River, NT
A 20% reduction in peak daily consumption, deferring supply-side augmentation, faster and at a fraction of the cost.
The client
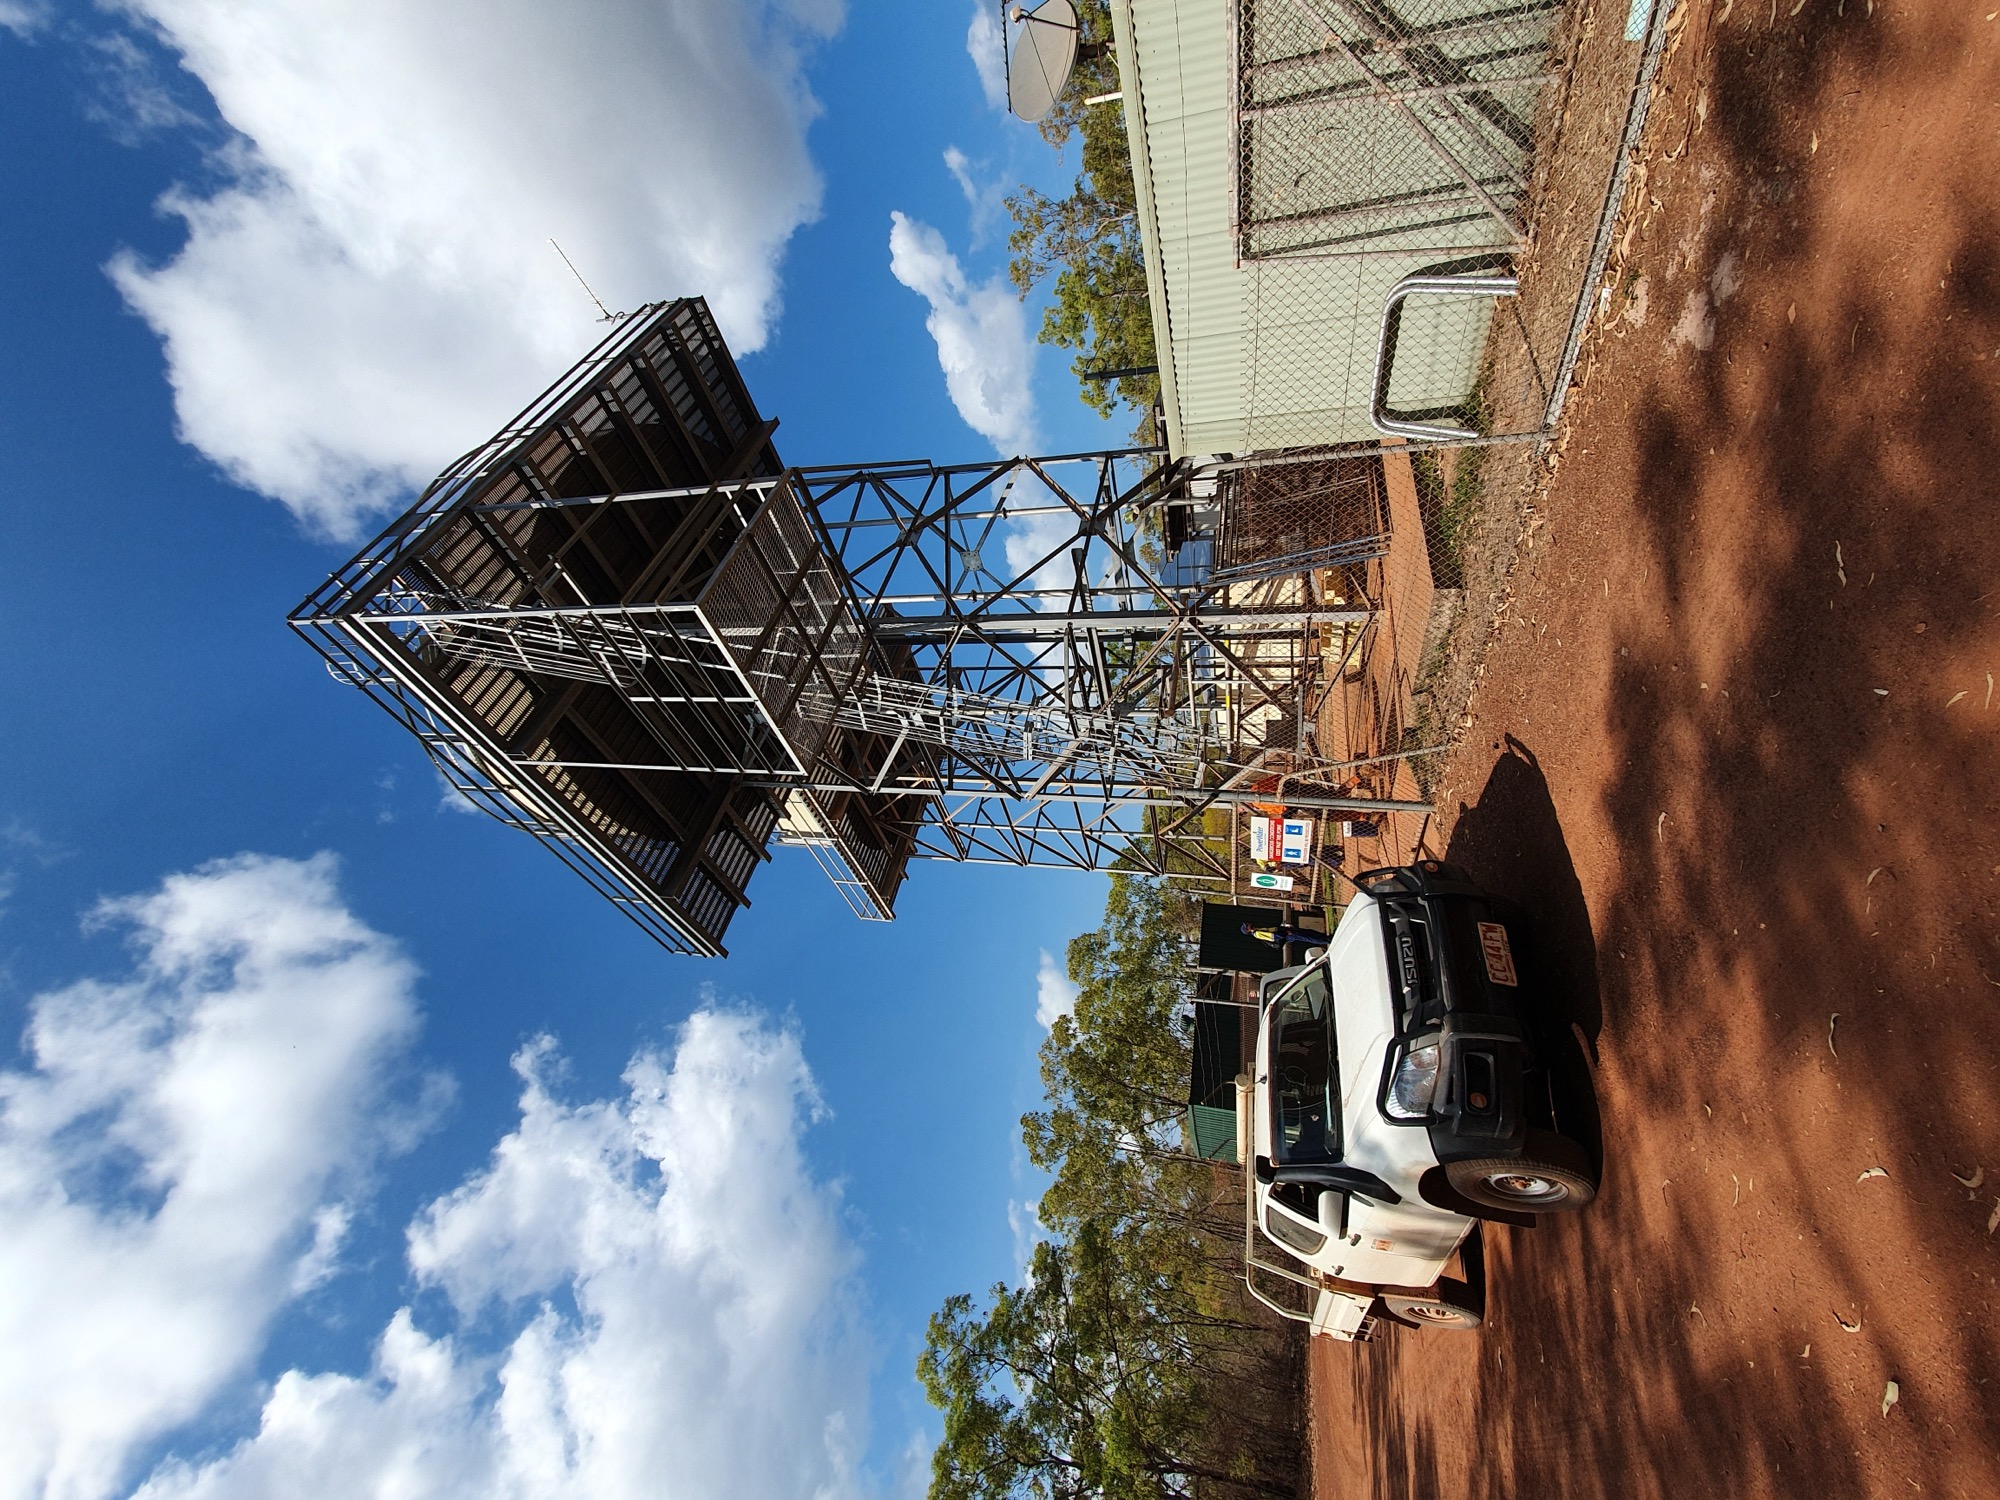
Power and Water Corporation (P&W) is the Northern Territory Government-owned utility responsible for the supply of water, sewerage, and electricity services across the NT, including to remote and regional communities. The Adelaide River township sits approximately 110 kilometres south of Darwin on the Stuart Highway, at the edge of the Top End's wet-dry tropics. This region is defined by one of the most dramatic seasonal rainfall patterns on the continent and the acute supply pressures that accompany them. Despite its geographic proximity to Darwin, Adelaide River operates as a largely self-contained supply system, drawing groundwater treated through a biological filtration plant commissioned in 2015 to address elevated iron and manganese levels in the local source. That single-source dependency makes the town acutely exposed to seasonal demand spikes with no neighbouring network to draw from when the margin narrows.
P&W engaged Eko to deliver a targeted demand management response to peak season water stress. The requirement was not simply to reduce consumption but to do so accurately, rapidly, and with minimal disruption to the community. Before any field activity could begin, P&W needed to understand where demand was concentrated. They needed that picture within the season, not at the end of a capital planning cycle. The central question the engagement needed to answer was whether a data-first approach could achieve the same supply security outcome as capital augmentation; at a fraction of the cost and in a fraction of the time.
Why it matters
Water supply in remote and regional Northern Territory operates under conditions that sharply amplify the consequences of demand management failure. Seasonal demand in the Top End is not a gradual curve, it is a steep spike driven by population movement, agricultural activity, and the absence of rainfall recharge across the dry season. When consumption climbs faster than supply can respond, the gap between what is available and what is being drawn closes quickly. Single-town supply systems have limited buffer. There is no interconnected network, no emergency draw from a neighbouring grid, no rapid augmentation option that arrives within weeks.
The default institutional response to this kind of pressure is capital investment in new or augmented infrastructure. That pathway is slow to procure, slow to construct, and expensive. For a regional town operating within fixed government funding cycles, the time between identifying a problem and completing a capital solution is measured in years, not months. What Adelaide River needed was a response that worked within the season the problem existed. That kind of response requires a different starting point: not how do we bring more water in at the top, but what and where is driving the consumption.
The problem
During peak demand periods, Adelaide River's water supply was coming under increasing pressure. P&W held historical consumption data, but that data had not been interrogated at the resolution needed to understand which properties were driving the peaks, by how much, or during which periods. Without that picture, any intervention would be blunt, reducing consumption broadly and hope the right properties were captured, rather than targeted at the actual concentration points.
The deeper issue was not the consumption itself but the absence of a reliable consumption map. Billing records, network data, and field observations existed in separate systems and separate conversations. They had not been assembled into a working picture of actual demand by property, by period, by peak. Decisions about where to focus interventions, which households to prioritise for community engagement, and whether supply augmentation could responsibly be deferred were all at risk of being made on a foundation that had never been properly stress-tested.
You cannot manage what you cannot measure. The consumption data existed. The analysis did not. That gap was where the supply risk lived.
Without a reliable baseline, demand management defaults to guesswork. Broad messaging campaigns reach everyone equally and therefore reach the highest users least effectively. Capital investment proceeds not always because it is the best answer but because it is the answer that does not require knowing where the problem actually is. The cost of not building the consumption picture first is not just financial. It is the cost of interventions that do not work, and a supply risk that accumulates while they are being tried.
Our approach
- Conducted rapid analysis of historical consumption data across the network to identify the highest-using properties. This established not just which properties were consuming most, but when, and by how much relative to the network average. This step came before any field activity, because without it, deployment of resources would have been spread across the network rather than concentrated where they could make the most difference in the shortest amount of time.
- Deployed data loggers on high-use properties to confirm and refine the consumption profiles established in the desktop analysis. Logged data validated what the historical records suggested and added the temporal resolution needed to understand demand shape, peaks by hour, by day, and across the full period, rather than just volume totals.
- Led community and stakeholder consultation to drive voluntary consumption reduction, structured around the specific insights the data had produced. Engagement was targeted rather than broadcast. The highest-use properties received direct, evidence-based conversations about their consumption rather than general messaging that carries no weight with any individual household.
- Tracked outcomes against the 20% peak daily consumption reduction target in real time, using the logger network to confirm whether reductions were being achieved and to identify where further engagement or intervention was required. The target was not set at the end of the program; it governed the program throughout.
The result
The engagement delivered a 20% reduction in peak daily consumption across the Adelaide River network. Supply-side augmentation was deferred. A rapid, data-driven demand management approach produced the supply security outcome that would otherwise have required capital works. And it did it faster, at substantially lower cost, and within the season in which the problem existed.
For a regional NT town operating within a single-source supply system, a 20% reduction in peak daily consumption is not a marginal improvement. It is the difference between a system operating within its design parameters and one operating at or beyond its limit. The significance of this outcome lies not just in the number but in what it demonstrates: when consumption data is properly interrogated and field deployment is targeted by that analysis, demand management can substitute for infrastructure investment in precisely the situations where infrastructure investment is slowest and most expensive to deliver.
Program context
Web search conducted across publications dated 2017–2026. No third-party published outcomes specifically attributable to this Eko engagement were identified. The NT Government's broader demand management trajectory is consistent with the strategic context of this work: P&W's demand management programs have been cited in the 2024 Northern Territory Government Water Demand Management Strategy as a long-standing foundation for the Territory's approach to water security. The 20% figure is sourced from Eko engagement records.
What it means to you
The consumption data is already in your network. What's missing is the analysis that turns it into a decision.
You manage water in a system that does not forgive seasonal surprises. Whether you're a sustainability officer defending the quarterly numbers, a facilities manager watching the meter run while the cooling tower log stays empty, or an operations lead quietly absorbing bill shock nobody upstairs has fully understood — you're the person whose name is on the plan. And you're working with data that exists in abundance but has never been assembled into the one thing you actually need: a map of who is consuming what, when, and by how much relative to everything else.
The frustrating part isn't that the data is missing. It's that the data has always been there — billing records, meter reads, SCADA outputs, field notes from technicians who've been telling you for years where the trouble spots are. It lives in separate systems and separate conversations. So when the pressure arrives, you're working from an average, not a map. You know the network is stressed. You can't say, with precision, where to push first.
Before Eko deployed a single data logger in Adelaide River, a desktop analysis had already identified the properties driving peak demand — by volume, by timing, and by their weight against the network average. That sequence matters. The field resources that followed went to the right addresses, not the most accessible ones. The 20% reduction wasn't achieved by doing more of what had already been tried. It was achieved by doing the analysis first.
Sources & references
Top End seasonal supply and single-source township context: Power and Water Corporation, Annual Reports and Service Obligation Reports (various years), powerwater.com.au
Adelaide River water treatment plant commissioning: Power and Water Corporation, Minor Centres water supply page.
NT Government demand management context: Department of Lands, Planning and Environment, NT Government Water Demand Management Strategy, 2024.
Demand management as an alternative to capital augmentation (general methodology): International Water Association, Water Loss Task Force / Water Loss Specialist Group guidelines.
Web search conducted — no qualifying third-party published outcomes specifically attributable to this Eko engagement were found within 2017–2026.