Smart meter data management, NT remote communities program
A validated, reconciled data platform across a remote network — monthly community-level water balances and quarterly billing reconciliation.
The client
Power and Water Corporation (P&W) serves a sprawling, remote customer base across the Territory's 1.35 million square kilometres — including dozens of discrete Indigenous communities accessible only by unsealed road, hours from the nearest regional centre, operating infrastructure exposed to extreme heat, wet-season flooding, and a climate that tests equipment and data systems alike.
Across this remote network, P&W had made a significant investment in smart water metering. The technology was in the ground and the meters were transmitting. But the data flowing into P&W's Aqualas platform had not been validated, reconciled, or quality-assured to the standard required to support the decisions that mattered — infrastructure investment, demand forecasting, and loss management at community level. The central question was consequential: was the data P&W was using to plan its remote water network actually telling the truth?
Why it matters
Remote NT water infrastructure operates under pressures with no capital-city equivalent. Extreme heat accelerates wear. Wet-season conditions create connectivity gaps that break data continuity. When something goes wrong — a significant loss, a billing anomaly, a metering failure — the response time is measured in days, not hours. In that environment, the quality of the underlying data is the first line of defence.
Smart metering is now standard policy across most Australian utilities. But deploying meters and managing meter data are two entirely different disciplines. Meters generate data; data management generates understanding. The gap between them is where most smart-metering investments quietly underperform — and for dispersed networks where manual auditing is expensive and access is constrained, that gap has direct consequences for how confidently decisions can be made.
The problem
On the surface the system looked like it was working — reads coming through, consumption recorded, reports generated. But underneath, the data had never been subjected to structured validation, reconciliation, and quality assurance. Connectivity losses left gaps. High readings carried through without investigation. Billing wasn't cross-checked against meter data at the frequency required to catch discrepancies before they compounded.
A meter that reports the wrong number with great consistency is not a smart meter. It is a confident one.
The consequence of dirty data compounds. Water balances built on unvalidated reads produce inaccurate loss estimates. Billing reconciliations based on unchecked data expose the utility to both over- and undercharging. Infrastructure planning made from unreliable consumption profiles carries a margin of error that grows with each decision layer. The problem wasn't a lack of data — it was that without a disciplined program, no one could say how much of it was reliable.
Our approach
- Integrated smart meter data into the Aqualas platform across the remote community network, establishing a structured pipeline between field devices and P&W's reporting environment — validated against real-world data before any analysis was built on top.
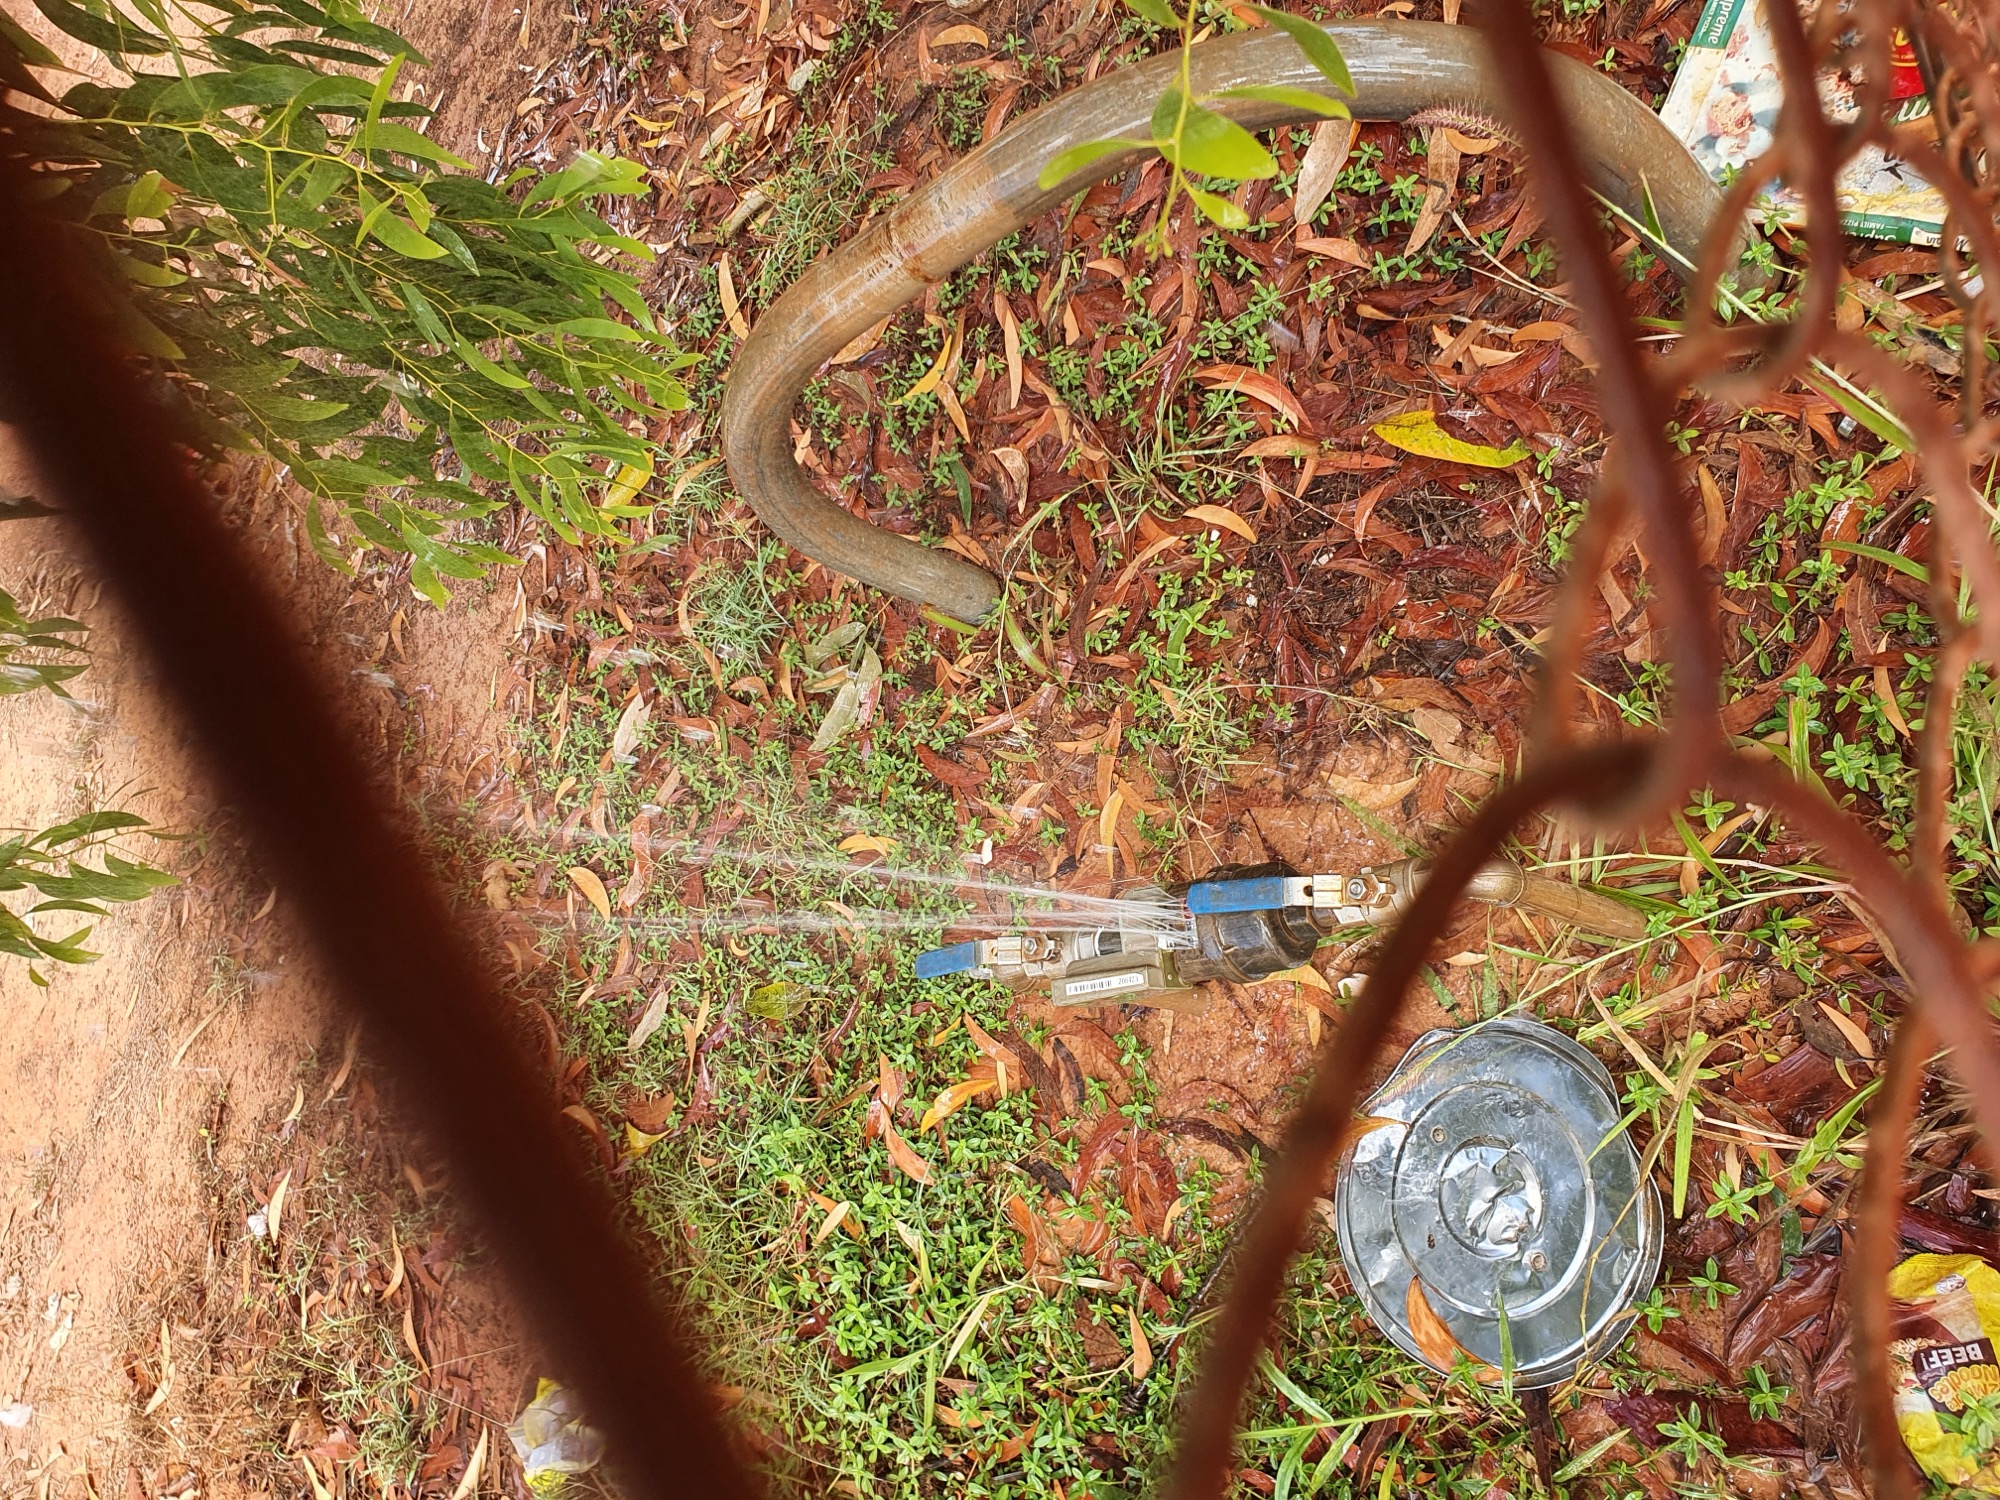
- Conducted site-visit validation and audit of data accuracy across the meter estate. Validation in a remote network requires physical presence; site visits confirmed device condition, connection status, and read accuracy against physical meter reads.
- Developed a process manual for future data-source integration, documenting the methodology so P&W staff could onboard new sources without starting from scratch.
- Calculated water balances for district metered areas and remote communities — establishing what entered each zone, what was consumed, and what was lost.
- Delivered monthly community-level water use and loss balance analysis, giving P&W a regular, structured view rather than a point-in-time snapshot.
- Conducted quarterly billing-record reconciliation audits, cross-checking meter data against billing records to identify and resolve discrepancies.
- Troubleshot connectivity losses, high readings, and data anomalies — each investigated and resolved rather than flagged and left.
The result
Smart meter data across P&W's remote community network was integrated into Aqualas and validated to a standard the utility could rely on for infrastructure planning and reporting. Monthly community-level analysis gave P&W a structured, ongoing view of consumption and loss — not previously possible at this geographic granularity. Quarterly billing reconciliation created a regular mechanism for catching and resolving discrepancies. A process manual was delivered for ongoing use. For a utility operating across one of the most remote service territories in Australia, the result was not just a set of reports — it was a reliable data foundation, the precondition for every infrastructure decision, loss investigation, and demand forecast that follows.
Web search conducted — no qualifying published outcomes attributable directly to this Eko engagement were identified within 2017–2026. Any specific figures from P&W annual reports should be confirmed by P&W before being referenced.
What it means to you
Your water data is moving. The question is whether it's moving in the right direction — or just moving.
You manage the water footprint of a business operating on the Gold Coast, and right now water is one of the harder line items to control. The bills arrive. The board asks questions. You present the numbers. But if someone pushed you hard enough on where exactly the usage is coming from — which site, which system, which fixture category drives the biggest portion of spend — you know the answer wouldn't be as clean as the presentation suggests.
The standard advice has been tried: more efficient fittings, better staff habits, the water authority's checklist that reads like it was written for a suburban household. And the bill hasn't moved the way it should — not because the interventions were wrong, but because they were built on a data layer that had never been properly validated.
Efficiency programs that run on unvalidated data don't reduce consumption. They reduce the appearance of it.
What P&W faced in the NT and what you face on the Gold Coast aren't the same in geography or scale. But the mechanism is identical. Data was flowing, reports were generated, decisions were made — and the underlying data had never been validated to the standard those decisions required. In P&W's case the consequence was unrealised value from a major investment; in yours, it's a water bill that resists every effort to move it.
Our approach is the Data-First Diagnostic. Before any hardware recommendation, efficiency design, or target-setting, we validate the data layer: what is the estate actually reporting, where are the gaps, where are the anomalies, what does the profile look like once the dirty data is cleaned? That sequence — data quality before action — isn't common practice. Most providers move straight to the recommendation, building on the same unvalidated foundation that caused the problem.
Sources & references
NT service-territory scale: Power and Water Corporation Annual Report (various years).
Smart metering policy context: Australian Water Association (AWA), Smart Water Networks Forum publications, 2019–2024.
No specific statistics unique to this engagement are cited in the body; operational details are sourced from the project brief provided by Eko Engineering.